


One of two crucial business success drivers is retaining your employees as a sustainable and reliable resource pool to ensure team harmony and that projects meet excellence standards. However, it doesn't come without establishing a corporate culture that favors fulfilling employee experiences and a sense of belonging - feeling part of a company's achievements. In this blog post, I will introduce you to ten employee engagement benchmarks for assessing the strength and success of principal employee engagement drivers within your company.
In all the engagement scores (benchmarks below), I'll explain:
- The benchmark data source.
- How to measure (calculate) employee engagement.
- How or when to use the benchmark.
- Pitfalls (if any).
- How it integrates with benchmark scores on the list.
- Wherever possible - a benchmark value signifying good, neutral, or poor.
You might have guessed that the second driver is upholding customer satisfaction (which we'll see lower down goes hand in hand with employee engagement scores).
To appreciate why employee contributions are vital to profitability, we should look at the other side of the coin - Employee Churn.

Why is excessive employee churn a no-no?
Losing staff through voluntary termination, firing, or any other reason is severely disruptive and falls under employee churn. A never-ending process of employees coming and going signifies the company's inability to attract and hold onto talent. It results in the need to constantly retrain recruits, with inevitable deterioration in quality control and customer service.
In addition, when existing staff witness peer ins and outs at a furious pace, it deflates morale, brand, and reputation - let alone the eye-popping (and unnecessary) rehiring/retraining/insurance costs or the slowdown in other team activities. Probably the worst ripple effect is that it freezes progress, limiting one's ability to launch new initiatives and plan for the future with commitment.
The Great Resignation that hit the US in 2021/22 sent a loud-and-clear signal that remote and hybrid working environments were highly desirable - creating an acceptable work/life balance as unshakeable industry benchmarks. Businesses that ignore the churn machine above and these new revelations will probably remain with an unstable workforce and continuously struggle to meet stakeholders' ROI objectives.
Launching a win-win employee engagement program
Achieving employee engagement benchmarks that will make your investors smile is not complicated. It revolves around deriving employee engagement data and leveraging the results to maximize employee morale and satisfaction without losing money. We’ve identified 10 (of many) that enable management to gauge the health of the primary employee engagement drivers and whether they work in the company's favor. Benchmarks, measured by KPIs, are the barometers to watch, much like a pilot checks the instrumentation readings to avoid bad weather and ensure a smooth transition to the destination.
The ones we have chosen qualify because they revolve around:
- Straightforward employee engagement survey results easy for SMBs and enterprises to measure and interpret - unlike many others requiring specialist input and convoluted brainiac involvement.
- Honest, frank, and non-penalizing employee feedback, powerful enough to provide accurate monitoring and penetrative insights with simplicity still in your corner.
- Calculating an average employee engagement score as the benchmark to separate performance above and below it.
- Finally, providing new perspectives by creating more focused and vivid employee engagement benchmark scores.
Our ten selected employee engagement benchmarks
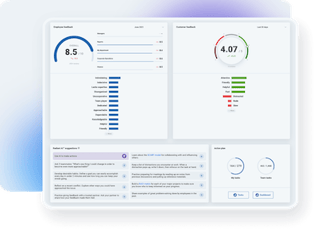
1. Employee NPS (eNPS)
In his book, The Ultimate Question, Fred Reichheld says there's no better way to know an employee's satisfaction and engagement levels than eNPS. Here's how it works:
a. Ask your team if they would recommend a friend or family member take a job in your company with a rating of 1 (never) to 10 (without a question).
b. After the survey results are in, divide them into "Promoters" (the 9 & 10s), "Passives" or "Neutral" (the 7 & 8s), and "Detractors" (0 - 6) scores.
c. Calculate each category as a percentage of the total.
The Net Employee NPS = The Promoters % - Detractors %.
b. After the survey results are in, divide them into "Promoters" (the 9 & 10s), "Passives" or "Neutral" (the 7 & 8s), and "Detractors" (0 - 6) scores.
c. Calculate each category as a percentage of the total.
The Net Employee NPS = The Promoters % - Detractors %.
A negative answer is severely disappointing, indicating a workforce with too many disengaged employees. So, what's a good eNPS? The possibility range is -100 to +100, where 10 to 30 represents a team on a constructive track, providing an acceptably good employee engagement score. However, a staff complement second-to-none aligned with the company's objectives and culture begins with a score of 50, extending to 80+ as a best-in-class rating.
 Measure eNPS benchmark data and install it as a mainstay quarterly or half-yearly employee engagement survey that management shouldn’t bypass, no matter what. Moreover, the survey is one thing; taking action is quite another. The idea is that stakeholders must springboard off eNPS to eject and objectively replace employee experience obstructions with attractions.
2. Customer NPS (cNPS)
This is the mirror image of eNPS (the employee engagement survey above), except you're surveying your customers quarterly or every six months with the question, "Would you recommend a friend or family member buy from our company." Then, the same measurement formula described above rates net cNPS from "Poor" (with negative scoring) to "Best-in-class" with a rating of 80+.
You may raise an eyebrow at this one, asking, "What does customer happiness have to do with employee engagement surveys or measuring employee engagement?" Everything. Happy customers align closely with positively engaged employees. Why? The latter directly impacts your customer service quality (today, that's 90% of the customer retention solution).

Every company's goals embrace generating more revenue, and inevitably, employees are front and center of that equation. So, customers benefit from exceptional employee commitment, motivation, and loyalty - by-products of high-functioning team dynamics and collaboration.
- High NPS (c & e types) scores lead to “22% higher profitability and 21% higher productivity” - an indelible connection to client satisfaction.
- When employees love what they do remotely or in the office, it builds a positive brand reputation among clients.
- Employee dissatisfaction spreads, overlapping into the marketplace because disgruntled people complain to everybody.
- Customers avoid toxic business environments because they ultimately contaminate customer service - the foundation stone of successful strategy.
- When employees are indifferent to customer retention it impacts this category's benchmark scores, as it does the employee engagement benchmark data across the board.
3. Employee Absenteeism (EA)
You should expect your staff to be absent for various reasons, within reasonable limits. It's when it jumps beyond the latter that one should be concerned. Employee absenteeism, voluntary or involuntary, is not in your face. It's one of those things that, unless you consciously monitor it, can escape attention.
Irrespective of the reasons behind employee stay-aways, unexplained excess absenteeism disrupts project team dynamics (and productivity). In extreme cases, endemic absenteeism can integrate itself as a belief - "It's okay to take a break in this company without consequences."
Calculating employee absenteeism percentage: Absenteeism days/Total number of workdays x 100.
- 1.8% is average, expected, and corporately healthy.
- 4%+ is a high absence rate.
We point out two caveats when looking at this:
a. Public sickness alerts (like flu) can kill good averages for time spurts. There's nothing one can do about that, and seeing gremlins in the dark corners that aren't there is counterproductive.
b. Watch out for Presenteeism. What's this? If your rate drops sustainably below 1.8%, it could signify that your employees are so afraid of repercussions that they arrive at work when they’re ill. As a result, they spread viruses to others, alongside below-standard productivity, stress, and prolonged tiredness.
4. Employee Retention Rate (ERR)
As described in our introduction, high employee turnover (churn) has horrendous consequences. So, bottom line, how sufficiently are you retaining your employees? In short, the effectiveness of this employee engagement metric (KPI) rides on measuring the volume of employees who remain with your organization over a given period. The Employee Retention Index = Your ability to retain employees and deliver a memorable employee experience.
To calculate the Employee Retention Rate for a period: The number of employees remaining in the company at the period end/The total number of employees at the period beginning x 100.
So, what constitutes solid employee retention?
- Generally - 90% or higher, although this falls into the area of industry-specific benchmarks.
- High rates characterize government, finance, insurance, and education enterprises.
- Low rates connect to food, retail, and hospitality.
- It also varies by job and location in all of the above.
However, some non-retention is desirable to make room for up-and-coming talent - especially in fast, dynamic positions.
5. Employee Turnover Rate (ETR)
Calculate ETR: The number of employees leaving during a period under each circumstance highlighted below/The average number of employees in the company over the period x 100
This is similar to ERR above - more or less the employees you failed to retain. So, why are we recommending it? Because ETR can give stakeholders a microscopic look at churn affecting one's employees, dividing it into those individuals exiting the company:
This is similar to ERR above - more or less the employees you failed to retain. So, why are we recommending it? Because ETR can give stakeholders a microscopic look at churn affecting one's employees, dividing it into those individuals exiting the company:
- From remote/in-office/hybrid arrangements.
- Voluntarily.
- In response to an unexpected change in personal circumstances.
- Involuntarily (such as firing).

6. Employee Learning and Development
Employees’ most significant gripe against a company’s culture is that they lack the resources to advance. It’s a criticism against the stakeholders fostering HR growth through learning and development (L&D). So, after launching robust L&D programs in the business from the onboarding stages through the entire employee lifecycle and promoting their accessibility, you want to know how effective they are. You want your L&D library and course schedules to be dynamic and vibrant employee motivators, not languishing in an unused resource pool.
How do you measure employee learning and development? Here are some sound directives:
How do you measure employee learning and development? Here are some sound directives:
- Review all the education programs quarterly to assess what’s used by whom and what’s falling by the wayside.
- Evaluation of applied learning projects by reviewing participation, bounce rate, and completion.
- Assessing performance before and after course completion.
- Measure the impact of L&D programs on performance KPIs where you expect to see movement.
- Appraise percentage certifications where applicable.
- Scrutinize supervisor reports and feedback regarding employees passing through the L&D programs.
7. Glassdoor.com Rating (GDRs)
Employer branding is crucial to recruits before climbing aboard. A mainstream review site with a stellar job seeker reputation is Glassdoor ratings. An organization’s Glassdoor rating depends on employee feedback, on a 5-point scale, where:
- 1.51 to 2.50 Employees = Very Dissatisfied (VD) .
- 4.01 to 5.00 = Very Satisfied (VS).
- The 2.51 to 3.50 rating (Okay) and 3.51 - 4.00 (Satisfied) fill the middle.
Suppose you have numerous employees covered in the GDR mix; we recommend emulating the eNPS formula to derive a Net GDR. How? Deduct the VS% from VD% (after dividing each metric by the total GDRs and multiplying by 100). Again, aim for at least 50 Net GDR and 80+ for excellence. Check the GDR versus eNPS metrics emerging - they should align.
8. Vacation Days Used (VDU)
Work/life balance depends on mentally and physically rested staff. Task overload for months with no break may indicate job insecurity, fear of scrutiny when away, or a workaholic nature. Alternatively, the company overloads work on too few individuals, resulting in thin vacation usage. From another angle, you may find low vacation days correlate with high absenteeism, accelerated ETR, or disappointing ERR (see these above) - an expanded perspective and unhealthy sign. In other words, this metric could result in some fascinating insights not achievable from single benchmarks.
Calculating VDU: Start by dividing the total number of days used by the max allowed x 100 to find the average. Similarly, calculate the same for every employee to see if they are above or below the average, looking for spikes/abnormalities. It will also help you decide on a corporate vacation policy and how many vacation days an employee can accumulate.
9. Employee Participation in Surveys
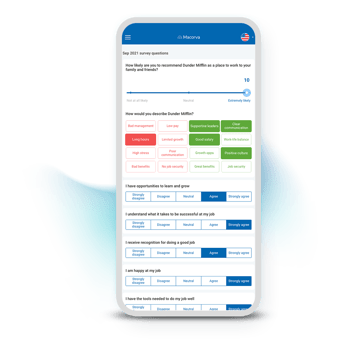
Successful employee feedback goes far beyond asking and receiving questions to ensure the responses are enthusiastic, energized by passion, and colored by the genuine belief it will be beneficial for the workforce. For this to occur, penetrative surveys launch off a technological platform aligned with your staff’s capabilities and circumstances. Make the questioning direct and straightforward (unambiguous), objective, and non-leading (unbiased). Avoid yes/no questions as much as possible. Why? Because these are feedback-centric formats. One-word answers tell us little.
Moreover, surveys cannot ignore follow-up action, so their frequency should align with stakeholder readiness to react to sound employee observations. Failure to respond will likely result in surveys losing employee respect. Finally, keep the employee surveys short, relevant, and anonymous to create traction.
Your company culture can encourage enthusiastic and sustainable participation by calling professional advice into your fold. For example, at Macorva we know survey respondents love to engage in quick, tappable options that are virtual, mobile-first, and a cinch to use. In addition, we make responding to feedback easy with automatically generated actionable insights and next-step strategies.
Calculate this metric: The number of completed surveys/The total number of employees invited to participate x 100 = Percentage of active employee participants.

10. Employee Satisfaction with Compensation
The last obstruction to employee engagement you want in your midst is people jumping ship for better money offers left, right, and center. So, crafting the proper survey to collect data around employee remuneration, incentive programs, and the "money side" of employee engagement can be challenging. Using an employee engagement tool like Macorva, our AI technology will guide you through the process with automatically generated survey questions beyond discovering if an employee is "happy" or "unhappy" with compensation. Moreover, Macorva collates the results seamlessly and automatically, deploying the latest and easiest-to-use software (also practical in many other benchmark options above).
Expanding on the above, deploy state-of-the-art employee engagement tools to save time, drive engagement, accelerate performance, and inject accuracy into your strategies. For example, our Radiant AI® technology demonstrates extraordinary capabilities, such as:
Expanding on the above, deploy state-of-the-art employee engagement tools to save time, drive engagement, accelerate performance, and inject accuracy into your strategies. For example, our Radiant AI® technology demonstrates extraordinary capabilities, such as:
- Free AI-generated performance benchmarks with every survey, even for custom inputs.
- Seamlessly identifying strengths and growth areas with actionable, easy-to-understand insights ready to share with your team.
- Instantly generating personalized resources based on employee feedback, survey data, and manager notes, enhancing engagement, retention, and performance.
Conclusion
So there you have it - ten of the best employee engagement benchmarks derived from employee engagement data. Companies like Macorva can help you with understanding and establishing employee survey benchmarks with unique viewpoints.
The most deflating benchmark experience is too many trial-and-error attempts with no headway. Macorva can significantly shorten the journey to a benchmark infrastructure that uniformly combats employee churn from every direction. The KPIs derived from Macorva team guidance emerge from engagement strategies that consistently and sustainably create employee loyalty.
But of course, we have highlighted a few critical metrics above that Macorva can influence. However, the same applies to every employee engagement activity involving survey technology and follow-up. So, contact us if you are ready to take employee satisfaction to the next level faster and more assuredly than you can imagine.
But of course, we have highlighted a few critical metrics above that Macorva can influence. However, the same applies to every employee engagement activity involving survey technology and follow-up. So, contact us if you are ready to take employee satisfaction to the next level faster and more assuredly than you can imagine.