


Sophisticated marketers picked up on this a few years later (in the 1960s), translating the ingenious slogan (repeated millions of times since then) into a groundbreaking concept that still drives brand competitiveness today. Their central message focuses on one’s need to understand the customer experience (CX) that emerges from using a product (or service), which depends on considerations that stand significantly apart from the commodity itself. Recognizing this subtle difference is the essence of industry leadership.
For example, Apple Mac customers’ experiences are not necessarily connected to the computer’s inside technologies and patented algorithms. Their only interest in those items can extend to how they are able to:
- Accelerate user creativity (i.e., that aligns with self-actualization, peer recognition, stress release, and excitement).
- Resolve complex challenges fast (i.e., reducing frustration).
- Improve relationships with peers, family, and friends (i.e., building love, companionship, and belonging).

All the words in brackets above describe the “sizzle factors” one may expect from buying a Mac. Knowing what they are, when they occur, and why—a penetrative probe into the emotions and thoughts triggered by customer experiences—creates memorable brands. We want to leverage and optimize the favorable influences while minimizing or erasing buying behavior obstructions.
As a result, measuring customer experience jumps to the forefront as crucial to marketing success. In so doing, it’s vital to establish insightful customer satisfaction metrics (i.e., KPIs for customer satisfaction) and feedback channels to indicate if the primary online and offline CX touchpoints help you to:
- Consolidate customer loyalty.
- Transition new customers into the retention ranks.
- Encourage customers to act as brand ambassadors.
- Reduce the cost of customer acquisition (CAC) and customer servicing (a benefit of brand loyalty).
On the other hand, client satisfaction metrics may highlight defective touchpoints that:
- Obstruct customer journey (CJ) completions.
- Motivate loyal customers to jump ship.
- Dilute or erase customer engagement you rely on for sustained sales revenue.
- Encourage customers to spread negative brand comments.
- Increase the CAC and customer servicing (a side-effect of customer churn).
Simply put, investing in a robust data collection and analytics program to measure brand user satisfaction at scale should yield substantial returns. This program should incorporate a mix of qualitative and quantitative approaches, utilizing the tools and techniques detailed below.

How to measure customer satisfaction - Metrics that matter
The top-rated quantitative customer satisfaction performance indicators are as follows:
- Net Promoter Score (NPS)
- Customer Satisfaction Score (CSAT)
- Customer Effort Score (CES)
- First Response Time (FRT)
- Customer Churn Rate
- Customer Lifetime Value (CLV)
Sophisticated marketers in every industry have relied on them to gauge customer satisfaction from different angles, agreeing that the insights derived make a competitive difference. We’ll look at each in turn:

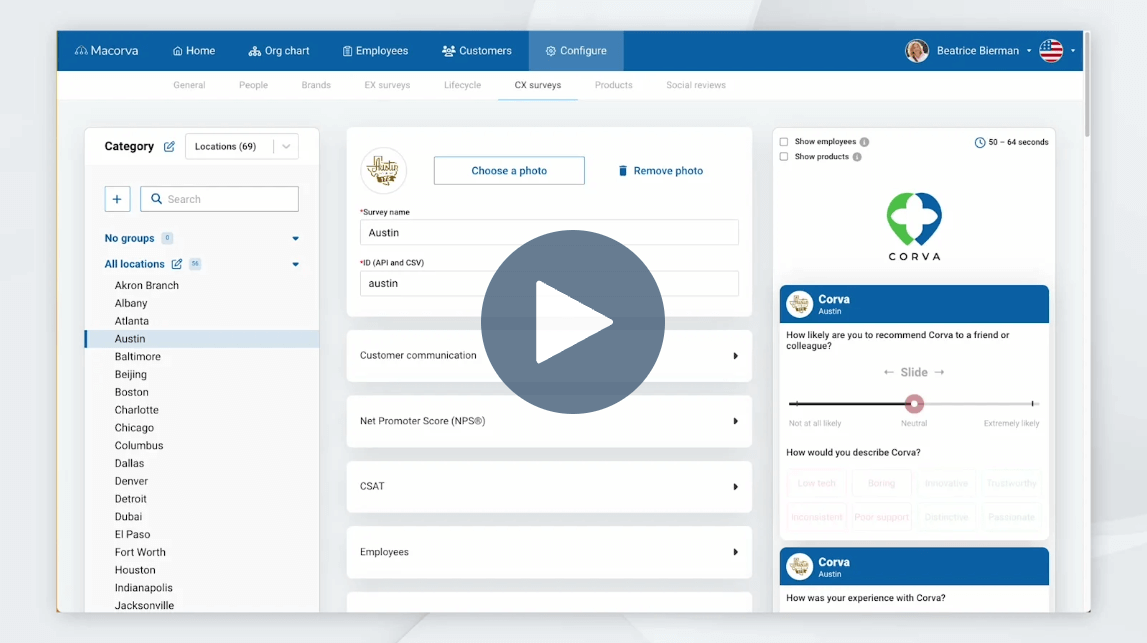
This metric has earned recognition as the most critical CX score—the best among all client experience metrics. But how can a single-question survey provide insight into a customer's perceptions and opinions about a company or brand? The probe must be robust to have earned such a reputation. So, what is this question?
"How likely is it that you would recommend [Company X/Product Y/Service Z] to a friend or colleague?" Rate it from 0 (not at all likely) to 10 (extremely likely). Then, take all the responses and configure a Net NPS Score as follows:
- Count the Detractors: All scores from 0 to 6
- Calculate the Detractors as a percentage of all respondents (call it X)
- Count the Promoters: All scores registering 9 or 10
- Calculate the Promoters as a percentage of all respondents (Y)
- The odd ones are Passives (neutrals or undecided): 7 and 8 scores. They don't figure directly into the next steps.
- Deduct X from Y for a net NPS
Net NPS possibilities range from - 100 to +100, where:
- Anything negative is alarming, indicating a significant uphill battle to offset the unfavorable customer sentiments.
- Positive scores are good but variable as follows
0 to 20 is on the right side of the equation, but there’s considerable room for improvement
21 to 49 is commendable but look for ways to rate even better
50+ is excellent
80+ is world-class excellence
Aside from the scores, how good is the question? Let's think about it for a moment. Its connotations go to the core of integrity and honesty. How?
- Firstly, most people are massively reluctant to mislead people they love and respect or even admit to anyone they would think about telling a lie to such an audience. Therefore, the “friend or colleague” content in the question underlines that the NPS response is likely honest, reflecting how respondents genuinely feel about the brand or company.
- Secondly, NPS formats involve respondent anonymity, which removes the significant “fear of repercussions” bias for telling it as it is.
- Thirdly, it's a bottom-line, black-and-white question. Although a neutral rating is possible, most respondents declare if they would or wouldn't recommend it, and the implications of a "Not likely" or "Extremely likely" answer are profound.
- Fourthly, the NPS, combined with a second open-ended question, "Why did you answer the way you did?" can create extraordinary qualitative insights.
Verdict: NPS is a five-star customer experience measurement metric.

- CSAT has a similar approach to NPS, except the survey question is:
“How would you rate your overall satisfaction with the [goods/service] you received?” On a scale of 1 (very dissatisfied) to 5 (very satisfied), derive an average as follows:
(Number of 4 and 5 rated customers / Number of survey responses) x 100 = % of satisfied customers, where a score of:
- 0 to 20% is severely troublesome
- 80 to 100% is exceptional
- Anything more than 50% reflects there’s significant customer engagement.
- 21 to 49% makes it “iffy”
A big tell is how CSAT trends from survey to survey (up or down). Also, it best evaluates customer engagement close to a specific event or touchpoint, not an entire customer journey.
Verdict: Anyone thinking about how to measure customer service or brand satisfaction must consider CSAT. It takes a lot to beat NPS, but this is a respectable option.
- FRT
We connect FRT to CSAT because they go hand in hand. Many businesses survive and thrive on how quickly they respond to service calls. Despite a specified maximum time in the Service Level Agreements (SLAs), companies may lose customers quickly if FRT is too slow in practice, especially in urgent situations.
How do you calculate the Average First Response Time?
The sum of First Response Times / Number of Service Tickets = Average First Response Time.
Measure the answer against what the SLA requires and, more crucially, what loyal FRT customers expect it to be. With reasonable certainty, poor FRT performance will result in negative CSAT scoring and likely have an adverse NPS impact.
CES aims at specific or narrowly defined touchpoints within a CX that covers several touchpoints in a long journey to the cash till, repeat purchasing, and beyond. So, for example, classic “customer effort score” case studies may look something like this:
Comcast Telecommunications company
We appreciate your feedback to the following question:
It was easy to get your internet issues resolved today.
1 2 3 4 5 6 7
I Strongly Disagree I Strongly Agree
This works on the same formula as CSAT, except 6 and 7 score responses align with satisfied respondents. Interestingly, NPS customers rated as "Promoters" on a broad CX vision (i.e., 9 and 10 scores) sometimes rate a focused touchpoint as CES 1 or 2.
Unfortunately, extreme dissatisfaction on a single touchpoint can swing loyal customers to another brand - that's how sensitive the CX balance is. Loyalists may change their mind and no longer recommend the brand to a friend (i.e., NPS). Indeed, it sometimes takes only one defective touchpoint amid hundreds of vibrant ones to upset the apple cart. So, you can't get enough customer feedback, and timing is everything.
When "custom churn" emerges at strategy meetings as a problem, all the alarm bells ring. Why? There's no more significant threat to ROI than customers rushing for the exits. Customer acquisition cost (CAC) is a massive consideration, multiple times higher than retaining a loyal one. So, having a handle on the churn metric is an indispensable aspect of strategy. Resolving a growing churn driver takes forethought and decisive action and its calculation isn't rocket science.
An churn calculation example is as follows:
A Wells Fargo branch decided they wanted to know the churn percentage over the 2023 Calendar year. Here’s what they discovered:
- Branch customers on January 1, 2023: 5673
- Branch customers on December 31, 2023: 5420
- New customers to the branch in 2023: 960
- Churned customers = a - b + c (i.e., 5673 - 5420 + 960 =1213)
- Churn rate = (d/a) x 100 or (1213/5673) x 100 = 21.3%
When over 20% of established customers abandon one's brand, even if the new customers made up for it (which, in this case, they haven't), it's a severe loss. Why? It takes multiple new customers to compensate for losing a loyal one. As a result, churn rate has emerged as one of the most reliable quantitative customer experience management metrics in marketing strategy and as a prominent KPI used to gauge customer satisfaction.
You can derive CLV by measuring your average customer's revenue from their first to last purchase—extending that to a net profit per average customer calculation—and comparing that number against the average CAC. When applied segment by segment (demographically and behaviorally), the metric as described fires on all cylinders to identify the ones delivering superior (or inferior) ROIs. CLV is particularly enlightening in B2B situations where one customer may comprise a segment. There's none better than CLV regarding "how to measure customers' satisfaction" across the board with a strategic outlook.
Integrating the metrics and obtaining fast access to them
Now that we've covered what types of metrics measure customer satisfaction, it's vital to appreciate that they function integratively. Why? No single metric can deliver a comprehensive picture of the client experience. It's all a matter of applying the techniques at the right time with clear objectives. In some cases, metric probes can progress in parallel while following sequentially in others. This is where Macorva steps in to save you from sweating over the logistics. As a leading company in the customer experience space, our advanced AI-driven software expertly measures customer experience, delving deep into the core of your CX projects.
As a result, you don't have to worry about which metric gauge to apply in different situations (historically, resources work at half-mast because matching and timing are inaccurate). With Macorva's expertise in your corner, regular, insightful CX metrics become indispensable data-centric assets. They're at the forefront of helping clients reduce CAC and Customer Serving Cost (CSC) while simultaneously upping retention.

Customer experience measurement tools and techniques
- Surveys: Given the metrics above, it should be clear that survey and feedback forms work well. Deliver them via appropriate website insertions or email, ensuring confidentiality and anonymity where warranted. In most cases, these are short single- or two-question surveys (see Metrics above), which you can incentivize with discounts and gifts to provide feedback (qualitative and quantitative).
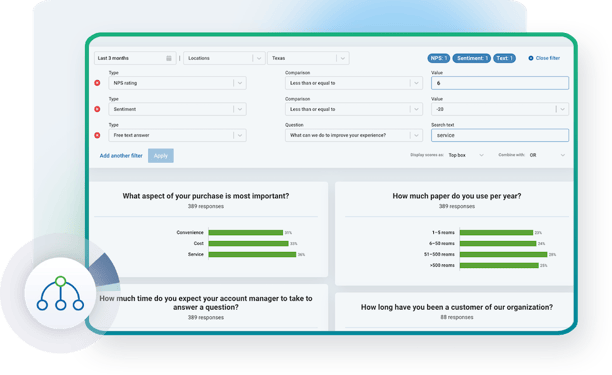
- Data analytics: Aside from distributing surveys, the heavy lifting revolves around analyzing the results and storing them in data banks (organizational silos) to align with all other market intelligence. This takes us straight to the topic of data analytics. With Macorva's software, you can quickly collect and analyze data, uncovering valuable insights much faster than traditional methods, thanks to our advanced tools powered by AI and ML technologies.
- Interviews and focus groups: This channel is expensive, limited in audience size, and requires skilled group leaders to guide the conversation. Nonetheless, it's a penetrating method that plays a vital role in digging deep into qualitative CX aspects arising from quantitative survey metrics.
For example, suppose one finds an unexplained upsurge in NPS detractors or customer churn (indicated by calculated percentages). In that case, a focus group may be the answer to dig deeper into the reasons surrounding the fall-out reflected in the KPIs.
It also functions exceptionally well when CES (a quantitative metric) falters around a crucial touch point. Focus groups, encouraged to get into the conversation, can reveal significantly useful behavioral information about CX. So, it ranks as one of the go-to customer satisfaction performance indicators when interfacing in-depth emotions and cognitive motivators.
- Social Media (SM) Monitoring: Customers talk about their experiences, airing opinions, complaining, applauding, and giving reviews on brand usage. SM represents a steady stream (and incredible source) of qualitative insights into CX dynamics, adding substance to generated quantitative metrics as long as you monitor them regularly.

Customer Journey Mapping (CJM) - The ultimate CX measurement tool
A customer journey map visually represents all the touchpoints through the customer's lifecycle. It addresses the complexities of broad data generation. How? CJM logically combines all the metrics and qualitative insights (covered above under the metrics and tools headings) for a holistic impression and overview of CX. In other words, it's the ultimate measurement method where quantitative and qualitative data merge. In short, it provides a multidimensional, bird's eye view perspective of how to measure customer experience.
Furthermore, Customer Journey Mapping (CJM) integrates seamlessly with advanced analytics and AI; it's not a task that can be effectively handled manually. Macorva's software capabilities scan all the relevant CX touchpoints from A to Z, connecting them to crucial data insights (quantitative and qualitative), thus making coordinated sense to stakeholders. CJM signifies that the user fosters a culture of customer-centricity. As a blockbuster strategic tool, it can:
- Quickly identify marketing activities misaligned with customers' expectations.
- Accommodate continuous feedback loops to detect changes that can occur in the blink of an eye, allowing the strategy to stay in touch with CX.
- Guide CX strategies to remain on course, yielding acceptable ROI returns and adjusting tactics based on fresh feedback.
In summary, CX measurement is a continuous process that combines quantitative and qualitative feedback within a robust data analytics framework to ensure precise and orderly interpretations. This ongoing evaluation allows businesses to refine their strategies, enhancing customer satisfaction and loyalty. By proactively adapting to customer feedback and market changes, organizations can maintain a competitive edge in an ever-evolving landscape.
Learn how Macorva CX can help you refine your customer experience strategies with detailed analytics and insights. Visit our platform page for more details or watch a 10 minute demo now.